
This is a matrix that shows the correlation of a certain amount of variables. This specific matrix uses colors to show the correlation. The more red the higher the correlation and the more blue the lower the correlation.


 A box plot is used to show numerical data. It uses 5 different observations, minimum, maximum, lower quartile, median, upper quartile. This plot shows the spread of light among 5 separate experiments.
 A histogram is used to show how many of something fall into a certain group or category. In the graph above it shows the frequency of the heights of black cherry trees.


 A scatterplot is used to show the results of data using 2 variables. A trend line is usually drawn to try and make the data a little easier to explain.
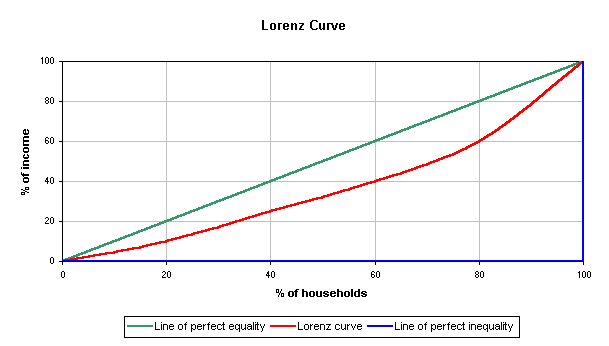 It is used by many economists to explain wealth and social inequality. It can be used to show what proportion of the households hold what percent of the wealth.
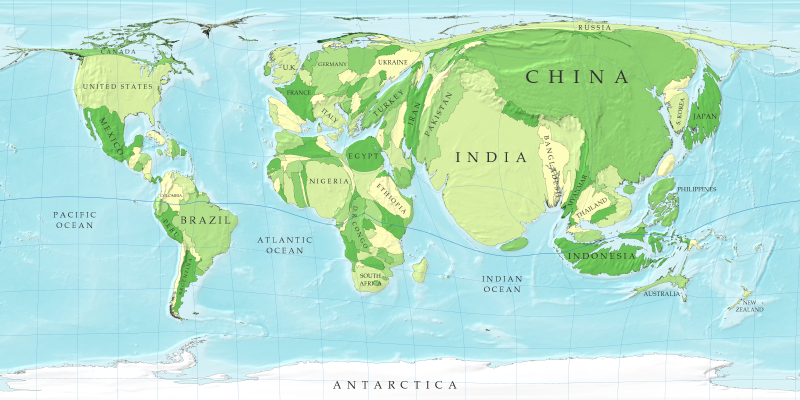
 This map shows the distribution of cervical cancer among women in areas. The brighter the color the more cases.
 This map type uses 2 variables on one map. In this example it uses life expectancy and GDP per capita. It also shows a correlation between the two.
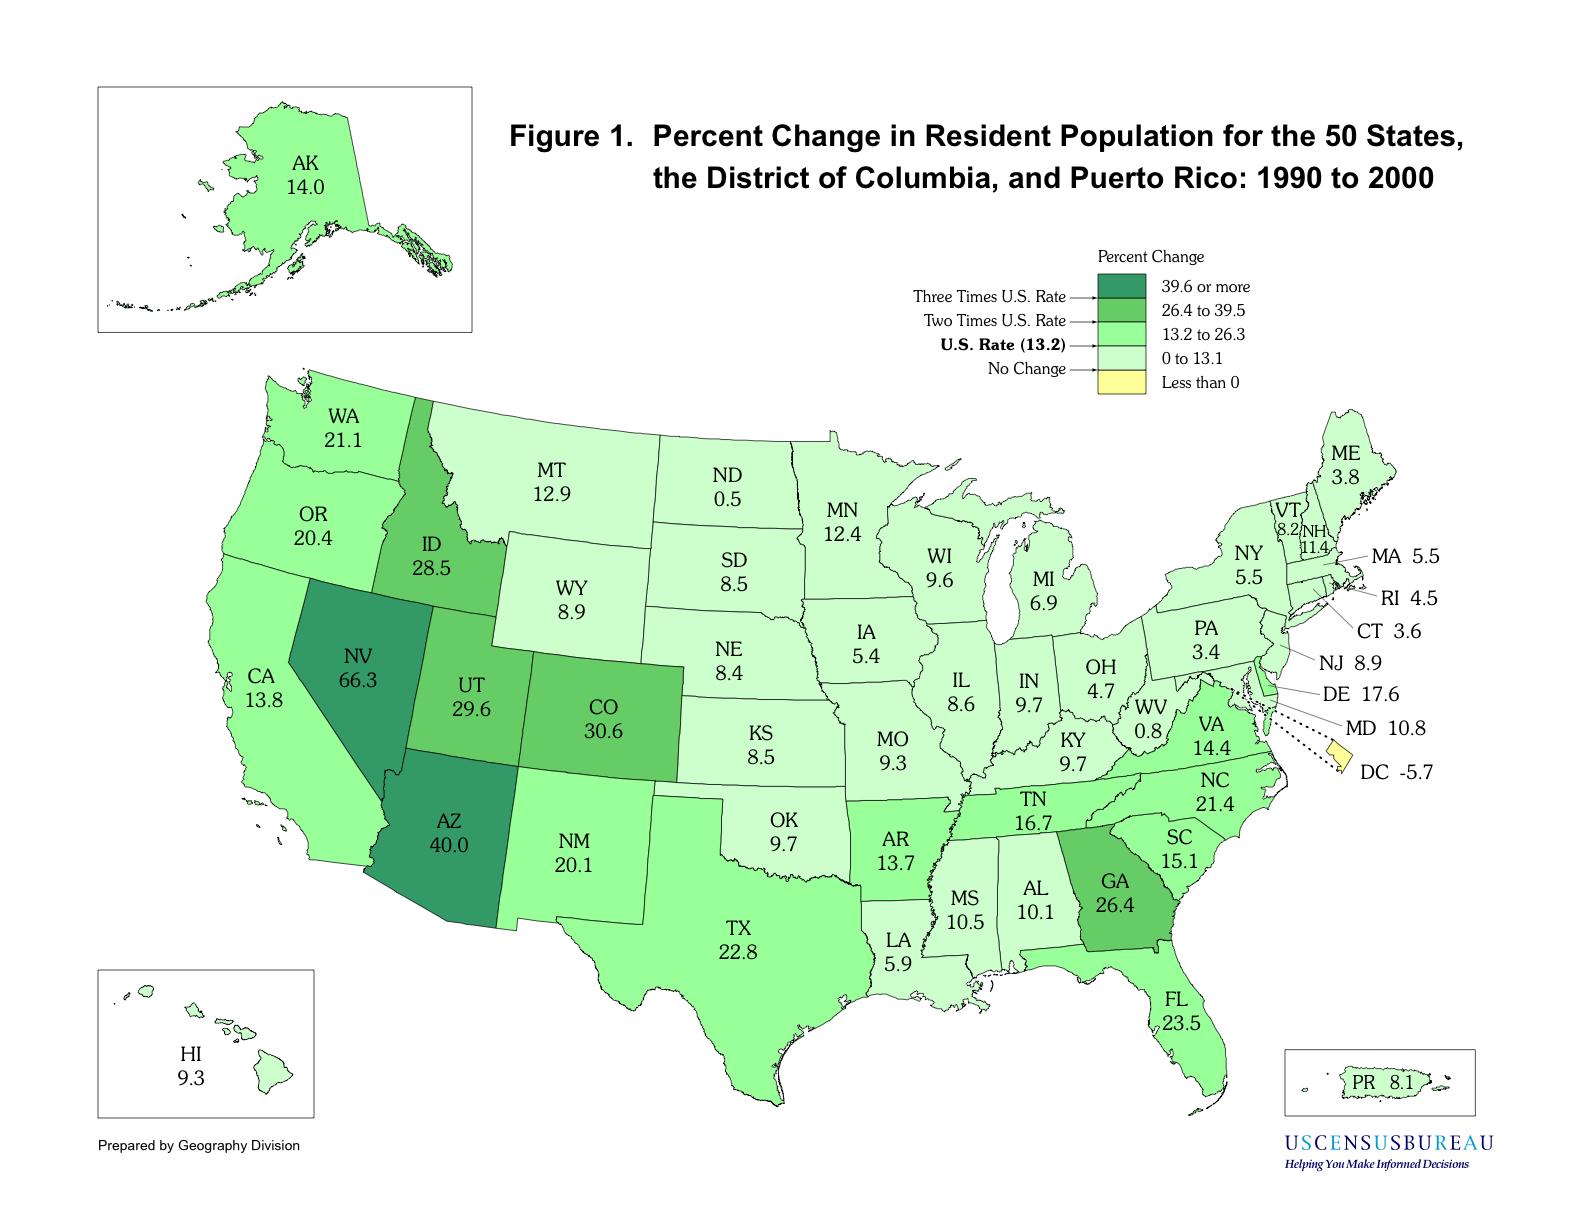
 The unclassed choropath map changes the distribution numbers into colors. In this case the darker the color the denser the population. The lighter the color, the less dense the population.

 This shows the population in certain cities. The larger the circle, the higher the population, the smaller the circle, the lower the population.


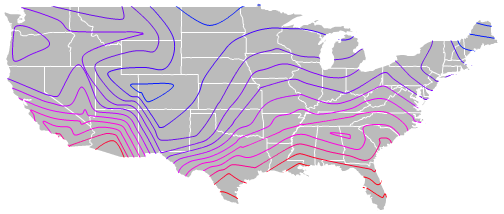
 This map is used to show the speed of the wind in areas. The darker the color, the faster the wind speed.


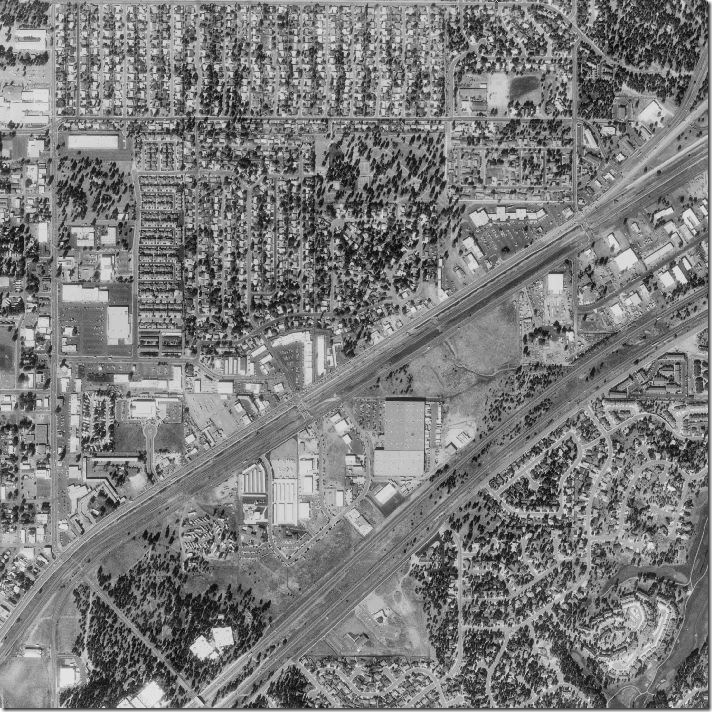


 A topographic map is very detailed. It usually uses different colors to show different land types such as mountain vs. flat land.

